29 Jul 2021
The new Delta variant has taken over and caused a renewed surge in infections in Wisconsin. I think this surge will continue for a while, but thankfully the vaccines will limit the consequences.
Delta is dominant
The Delta coronavirus variant, also known as B.1.617.2 - I think they’re doing an experiment on us to see which naming system is more inscrutable - is now dominant in Wisconsin as well as the rest of the country. Below is a plot over time of the fraction of all virus samples that have been sequenced - that is, have been genetically tested to see which variant strain they belong to. This data is taken from covariants.org, which in turn draws from the GISAID database.
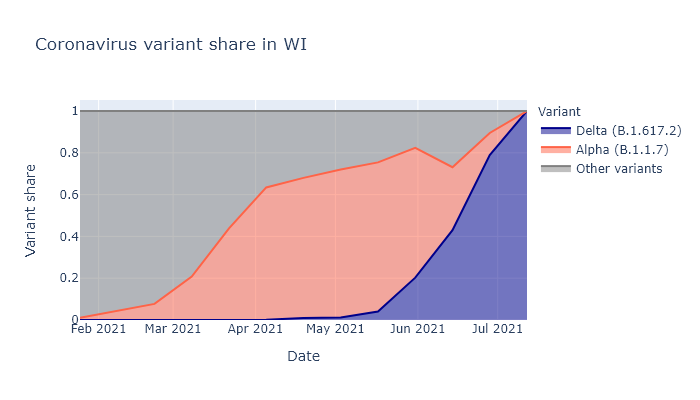
We can see how the two most important variants, Alpha (B.1.1.7) and Delta (B.1.617.2) have taken over in turn. There are many other variants of course, but these have been the important ones because each was a step up in transmissibility compared to previous strains.
To look at how the change in variant share influenced changes in cases, I multiplied these variant shares by the case numbers for Wisconsin to estimate which cases stemmed from each variant. The plot below shows how the last two case surges have both coincided with a new variant taking over and increasing its numbers, while the other variants continued declining.
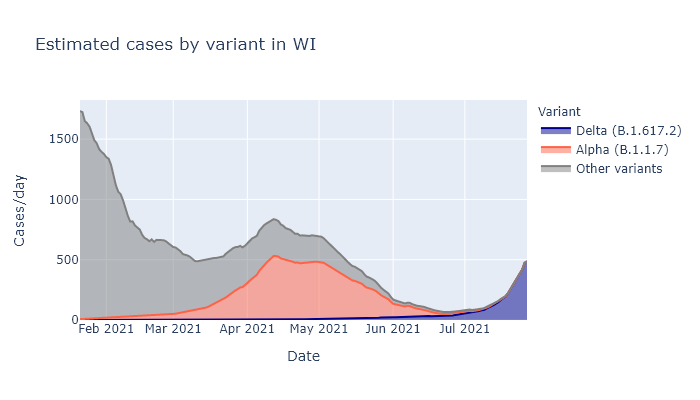
Whatever combination of immunity and other factors was leading to the decline of the previous variants were still effective - for those variants. Only the new, more transmissible strains coming in allowed the virus to come back resurgent.
The Delta delta
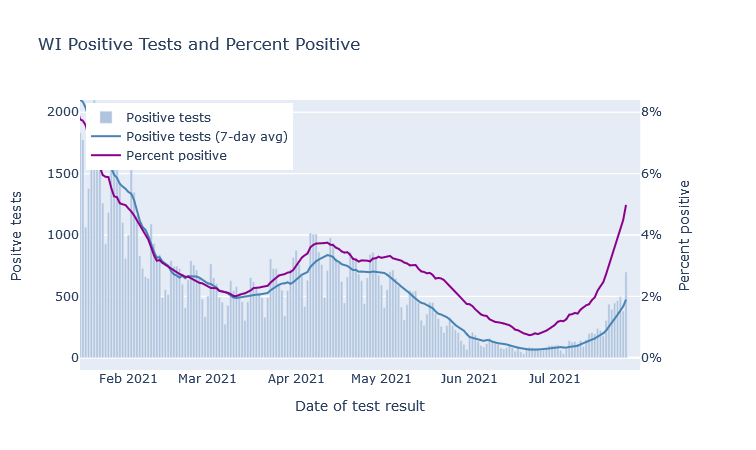
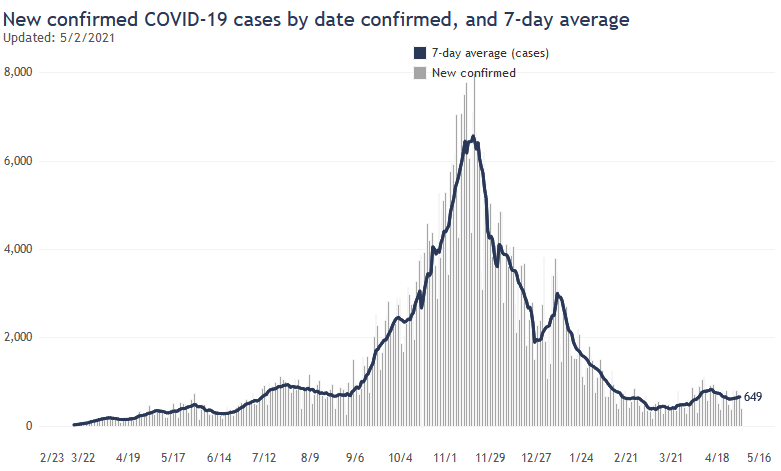
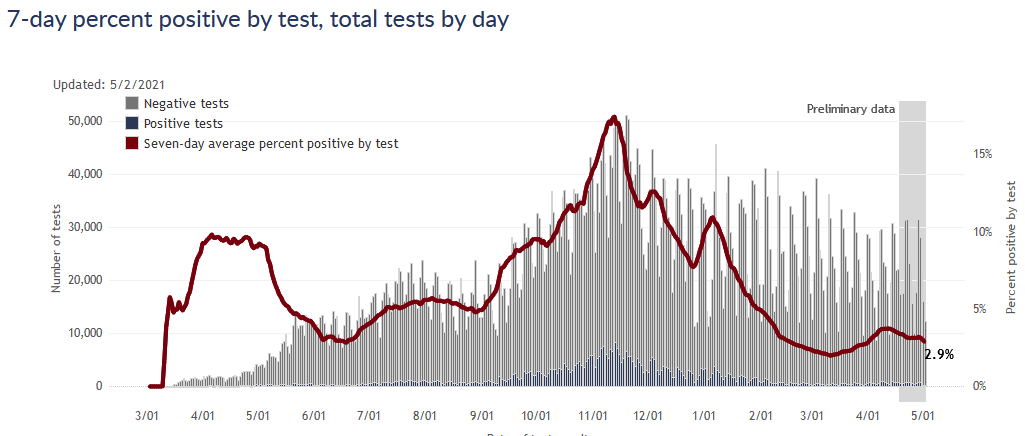
As already seen, the Delta variant has caused a… delta in infections, which we can see in both detected cases and the test positivity rate.
There could also certainly be contributions from seasonality (air conditioning weather) and the ongoing return to normal-ish behavior. Seasonality probably explains much of the differences between Wisconsin and the hotter southern states, which have it much worse right now.
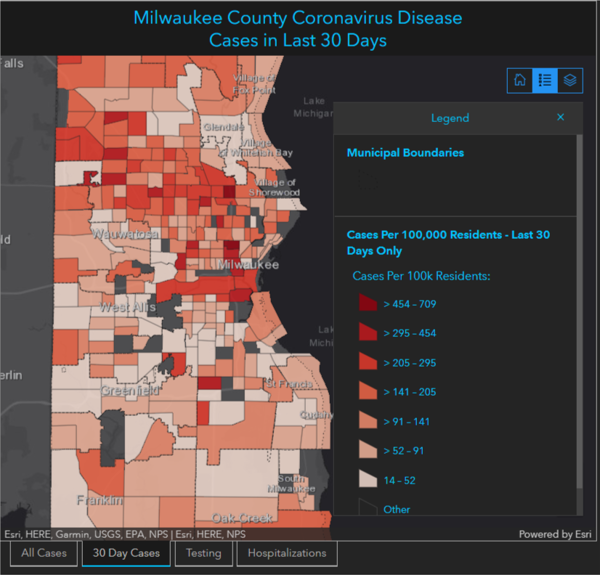
If we look around the state, we can see these increases are happening pretty broadly. The map below illustrates change in cases over the last month; the outer circles show the latest 14-day average of cases in each county, while the inner circles show the same average from two weeks past. The larger the donut, the bigger the increase; the darker the inner circle, the higher the per-capita case rate.
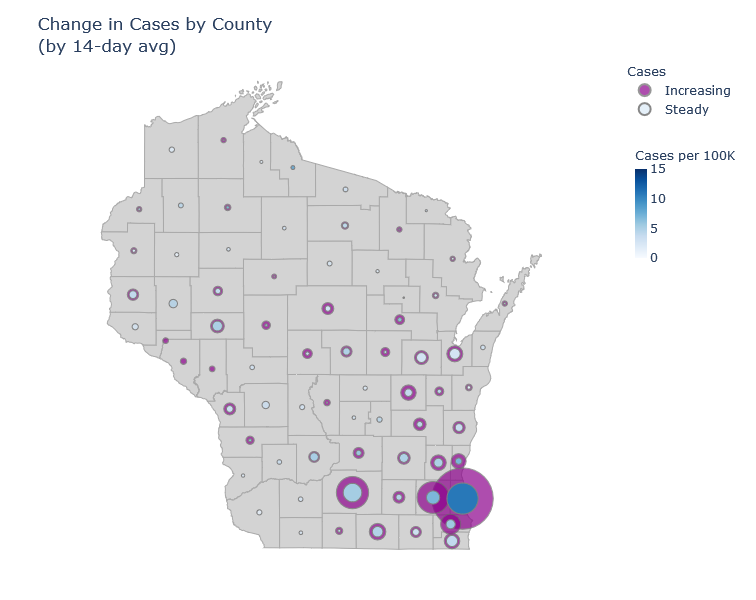
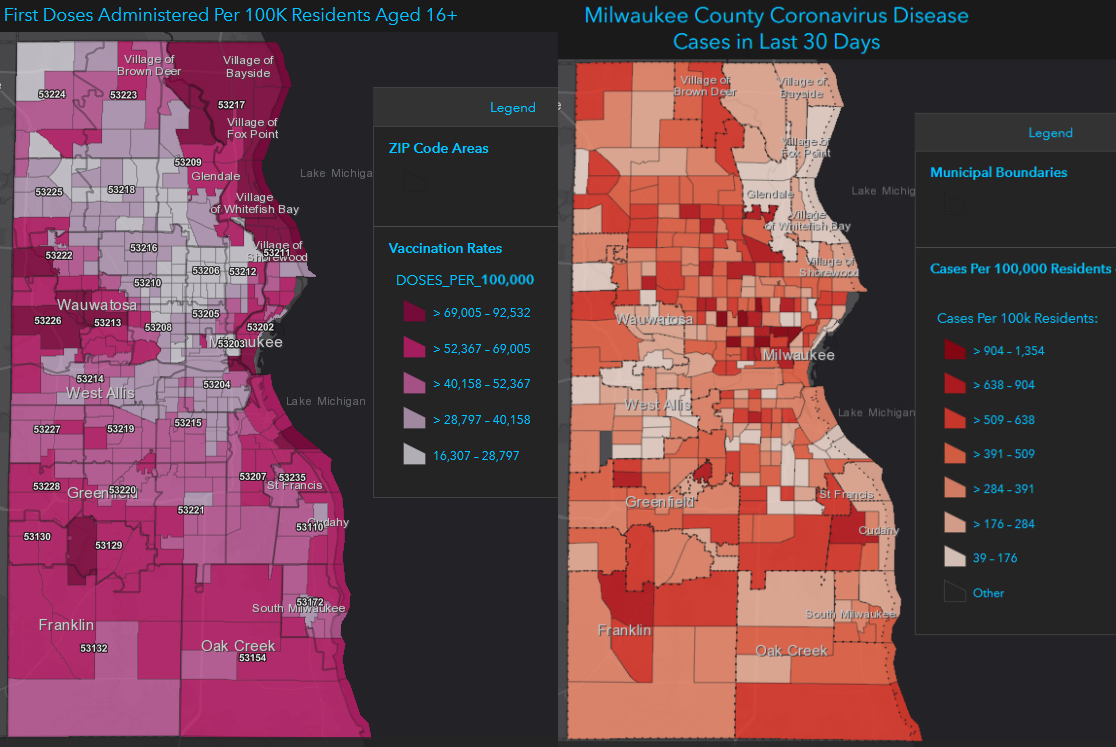
I don’t see much of a regional pattern here, certainly not like last fall in the northeast. Milwaukee County has the highest case rate, and there the cases are concentrated in the north side of the city, which also has the lowest vaccination rates.
Downplaying and doomsaying
Four weeks ago, I would have written that everything looked great (which is why it was easy to put off writing). I don’t think that anymore, but neither is everything terrible. For one thing, the numbers so far are still low compared to other phases of the pandemic. The rate of cases per day is not yet even as high as our last mini-wave in spring (though positivity rate is higher), and is less than 10% of the peak last fall.
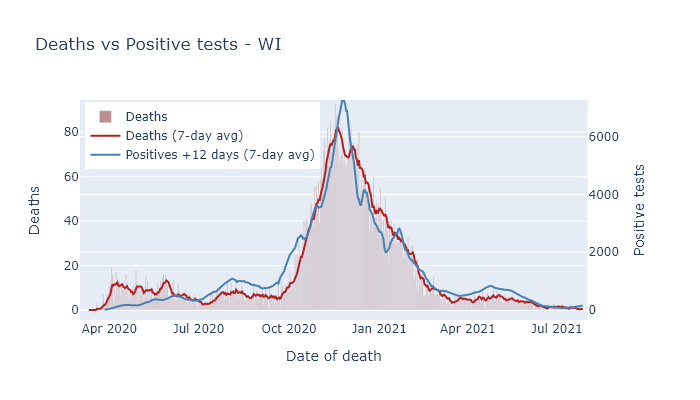
A second reason to be optimistic is that the great majority of the most vulnerable people are vaccinated, including over 80% of those over 65. This will decrease the death rate going forward. Below is a plot comparing cases and deaths in Wisconsin over the course of the pandemic, scaled to roughly match up during the fall peak. The late spring mini-wave already saw a reduction in the ratio of deaths to cases, and I would expect that reduction to hold for this wave as well.
And while we do not have herd immunity (clearly), it is still likely that about two-thirds of the state has some level of immunity from vaccination or previous infection, which ultimately limits the amount of damage that Delta can do.
On the other hand, I don’t have much hope that this wave will turn around any time soon. During the spring mini-wave we had the cavalry coming: vaccinations were happening fast and summer was approaching. Now vaccinations are slow - though for the moment there are still more people getting vaccinated every day than getting infected - and fall is coming. If this wave follows the pattern of last year, it will plateau a bit at the end of summer and then take off again in the fall.
The best solution is more vaccinations. They are picking up slightly already. For anyone who has been waiting, now would be good time.
14 Jun 2021
Wisconsin is about half vaccinated, but when you take into account previous infections, the fraction of people with some immunity is more like two-thirds.
To get an estimate of total immunity in the state, I’ll start with the number of people vaccinated, which we know pretty well, and then incorporate the number of people with prior infections, which requires some estimation.
My read on expert opinion is that both types of immunity - from vaccination and from prior infection - confer good protection going forward. There may be hairs to split between them, and in fact a combination of the two may be the most protective - so it is likely still helpful to get vaccinated even if you have been infected before. But here I’ll treat them as equivalent.
Vaccinations
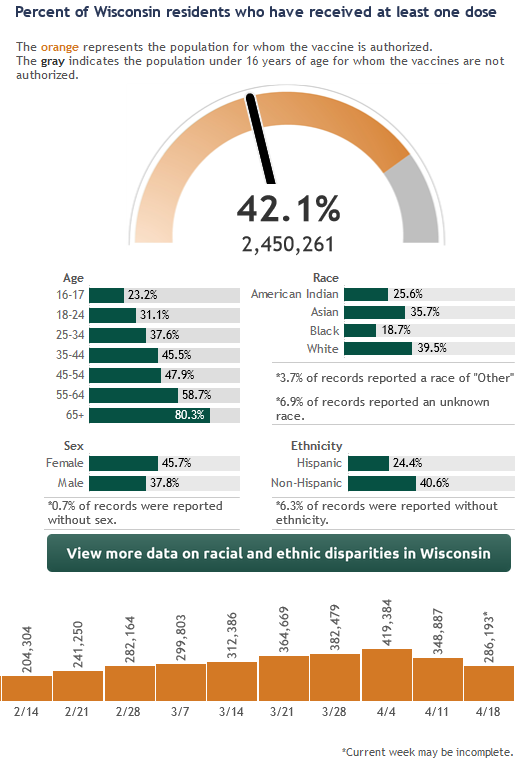
The state DHS reports that 49% have received at least one dose of the vaccine. Oddly, the CDC reports a higher number of 52%. I don’t know what to make of this discrepancy, which amounts to close to two hundred thousand people and several weeks worth of first doses. My best guess is that the CDC numbers are including some federal programs that aren’t included in the state’s data for some reason. I’ll use the state’s data because it is more detailed, but it may be that we have a few more percentage points of vaccinations than it shows.
Infections
The number of confirmed cases in Wisconsin is about 610,000, or 10.5% of the population. But we know this underestimates the true number of infections, so we need more information.
The CDC now has a national seroprevalence survey, which samples blood taken from people for non-Covid reasons and tests it for Covid antibodies. The most recent survey puts Wisconsin at 30% infected, which seems pretty reasonable to me.
Another way to get an estimate is to take the number of deaths and divide by an assumed infection fatality rate. Assuming a 0.45% IFR as in a previous post, following virologist Trevor Bedford, that would imply 27% infected, very close to the CDC number. (7200 deaths, divided by 0.0045, divided by 5.8 million people in Wisconsin.)
Based on these estimates, the true number of infections is larger than recorded cases by about a factor of 3. For convenience I’ll use this nice round number for the rest of the analysis.
How many are immune?
So we have our two numbers. 49% of the state is vaccinated, and 31% have been infected, and of course there must be some overlap between the two. To figure the overlap I’ll assume that the two things are independent; in other words, being previously infected does not affect someone’s likelihood of being vaccinated.
The graph below illustrates the estimate. The green bar shows the percentage of vaccinated people, the blue the percentage of previously infected, and their overlap represents people with both a previous infection and a vaccination. The combined spread of the bars shows the total immunity.
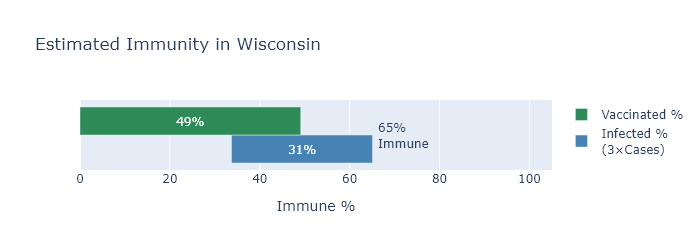
Now in reality I would guess that someone who had a previous infection is somewhat less likely to be vaccinated, whether because they have been less concerned about Covid all along, or because they recognize they already have some immunity. If this is the case the vaccinated and infected bars would move apart, the overlap would decrease, and the total immunity estimate would go up. So 65% may be a conservative estimate.
By age
Another consideration that we know reduces the overlap between vaccinations and infections is age, at least among adults. In general, older people have been less likely to get Covid, and more likely to get vaccinated (very sensibly, since the risk of Covid increases rapidly with age). But this entails that the age groups with the fewest vaccinations have also had the most infections, which in a way makes up for low levels of vaccination. So although the vaccination rate varies pretty broadly between (adult) age groups, my estimated immunity rate is much less variable.
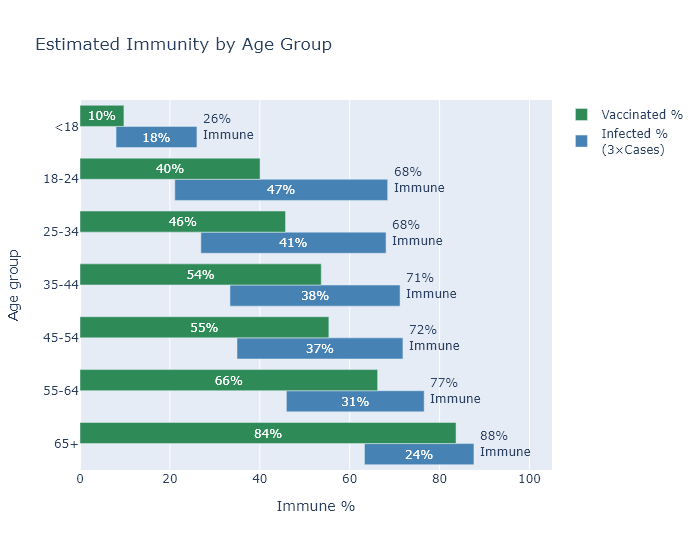
The big exception to this pattern are those under 18. They have had both few infections and very few vaccinations, since most of them are not even eligible for the vaccine yet. The good news is that driving down the virus numbers overall is having the desired spillover effect for cases in children.
Is it enough?
Probably? I find the 65% number encouraging on the one hand, because it will certainly be enough to prevent large surges like last winter, and because the number is even higher for the higher-risk age groups.
But I am a bit discouraged on the other hand, because I would love to just grind coronavirus’s knobby little spike proteins into the dirt, and I don’t think 65% is going to quite get us there.
Without more vaccinations I think we’ll continue to see cases at a low level over the summer and a smallish wave in the fall. Not enough for a renewed crisis - just enough to hope for some more vaccination progress over the summer.
09 May 2021
I like the mRNA vaccines and do not think they are risky, even though they use new vaccine technology. Here’s what I know about them.
I am not a vaccinologist or anything close, so this is just the summary of someone who reads too much Wikipedia. But hey, that’s all of us this year, so maybe it’s still useful. I welcome any corrections.
Actually my favorite source on vaccine development is not Wikipedia, but Derek Lowe’s blog. He is a scientist who has worked on drug discovery for many years. His blog is exceptionally helpful, accessible, and frank. I’ll be linking to several of his posts.
How they work
The mRNA vaccines deliver mRNA molecules, bound up with some fats, into your cells. Recalling from high school biology, mRNA is short for messenger RNA, and its normal purpose is to transfer instructions for making proteins from the permanent DNA in the nucleus to a cell’s ribosomes, where the mRNA is translated into the sequence of molecules to build a specific protein. In the vaccine’s case, the mRNA codes for the coronavirus “spike” protein, which is the spiky bit in the virus cartoons that you see, and helps the virus enter our cells.
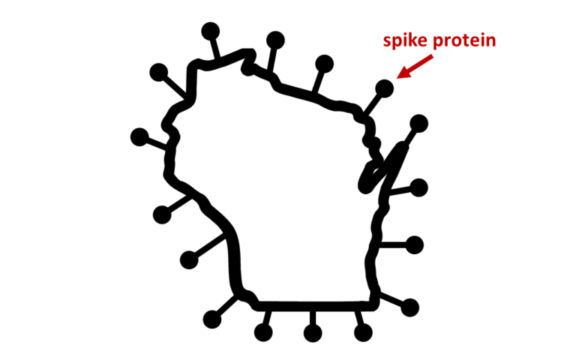
The spike protein then finds its way from the ribosome to the cell surface, where it triggers an immune response. The reason we inject vaccines into a muscle, I recently learned, is because that keeps all this activity localized to that muscle and nearby lymph nodes. The vaccine and spike protein don’t go circulating through the whole body.
HmmRNA?
Now playing around with genetic material may sound a little dicey. There’s even a claim that these are not proper “vaccines” at all, but more like gene therapies. But I do not think this is accurate. First, the mRNA in these vaccines is not DNA, does not enter the nucleus, and therefore cannot get incorporated into a cell’s genome. It enters the cell, floats around until it gets taken up by a ribosome, and then gets translated into spike protein.
In fact, inserting RNA into our cells is also exactly what the coronavirus does. That’s how viruses replicate - they insert their genetic material into our cells, where it gets translated into viral proteins. Unlike the vaccine, however, the virus itself codes for many different proteins, so that the cell will build new whole viruses. These accumulate until the cell bursts and releases them to infect other cells.
So sure, all things equal, I would rather not have foreign RNA inserted into my cells. But I would rather have it be the RNA for exactly one protein, precisely selected to prime my immune system to avoid a disease, rather than the entire genome of a hostile infectious cell-killing uncontrollably replicating invader.
Inserting RNA or DNA into our cells is also exactly what many standard vaccines do. Many common vaccines, such as measles, rubella, one type of polio, and smallpox back in the day, are “attenuated virus” vaccines. This means they contain active virus that has been weakened or altered - bred in a certain sense, by letting it evolve in human cell lines in a lab - to not cause disease. It does still infect you, though, by inserting its genetic material into your cells and replicating.
So while our attenuated-virus vaccines have shown to be very safe, they are still active viruses, and they can have a remote risk of regaining virulence and causing disease after all. That can’t happen with the mRNA technology, which gives it an intrinsic safety advantage.
VroomRNA
The contrast between these types of vaccine also helps explain why development was so quick for the Covid vaccine. Part of the reason that vaccines usually take so long to develop is that the “breeding” of these attenuated viruses can take a long time, and is difficult to steer in the desired direction.
For the mRNA vaccine, in contrast, the difficult part was knowing which protein to target. But we knew to target the spike from previous work on the original SARS. After that, it was only a matter of sequencing the virus gene for the spike, manufacturing the mRNA, and doing the testing in clinical trials.
The testing was actually the longest part of the process. It was sped up with lots of money, lots of volunteers, and lots of coronavirus circulating - not, as far as I know, by any reduction in rigor.
HarmRNA?
These clinical trials, as well as ongoing monitoring as the vaccines roll out, has satisfied me so far that these vaccines are indeed safe. To begin with, the trials enrolled tens of thousands of people and found no safety issues (and also phenomenal 95% efficacy at preventing Covid).
Now, these trials cannot rule out very rare, one-in-a-million side effects, for the good reason that tens of thousands is less than a million. But by now the vaccines have been given to hundreds of millions of people, so we should start to see any rarer effects if they exist.
The most serious side effect discovered so far is a risk of blood clots connected to the Johnson & Johnson vaccine, which does not even use the mRNA technology. For this side effect, the worst prevalence by age and sex is 11.8 cases per million shots in women 30-39.
So let’s compare that to the risk of Covid. For the age group 30-39 in Wisconsin, so far there have been 47 deaths and 94000 cases recorded. We know the cases are an undercount of infections, so multiply by, say, 4. That comes to 125 deaths per million Covid infections.
There’s uncertainty here, particularly in how many more clotting cases may be unreported. But I am comparing all the clotting cases (not just deaths), for the worst-hit age group, which is a relatively low-risk age group for Covid…and Covid is still 10x worse. And this wasn’t even an mRNA vaccine! It seems to me they are looking pretty good.
The long and short of it
The one area of risk where we do not have data is for very long-term side effects, for the good reason that there hasn’t been a long term yet. It’s possible that after some months or years some ill effect of the vaccines will show up.
But doesn’t that have to be even more true of Covid?
Which is more likely to have unknown long term effects? A dose of mRNA that makes your body produce some spike protein one day in your shoulder muscle? Or a virus that delivers the same mRNA and more besides, wildly replicates throughout your respiratory tract over the course of at least a week, and even kills a percentage of its hosts?
From what I have learned about how they work, I see no reason that the mRNA vaccines would be any less safe than other vaccines. The data we have supports their safety and efficacy. And to the extent that they may have unknown risks, simply from being new, I think the new coronavirus is clearly much riskier.
02 May 2021
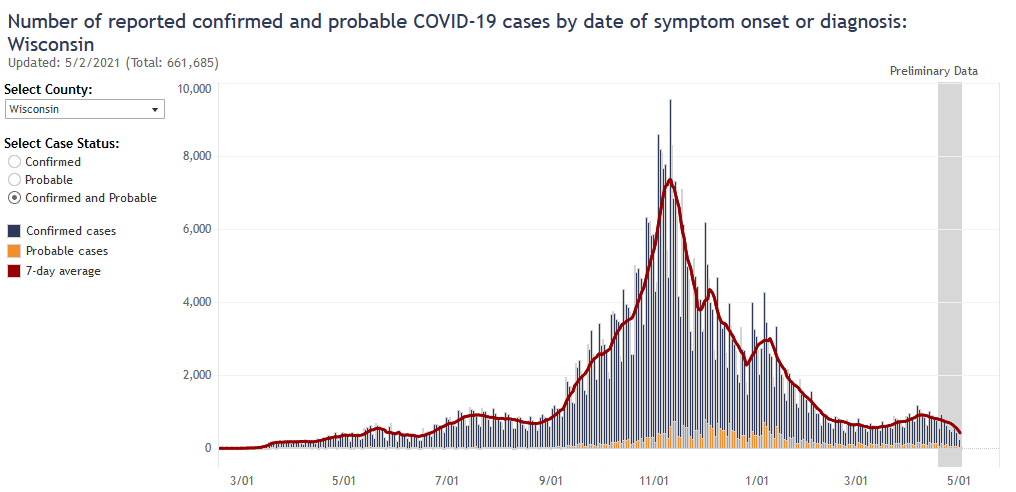
The Wisconsin Covid data are sending some mixed signals this week. Infections are probably flat or slightly down, hospitalizations still up from the recent small wave, and deaths flat. Cases in high schoolers may be up slightly, which is something to watch going forward.
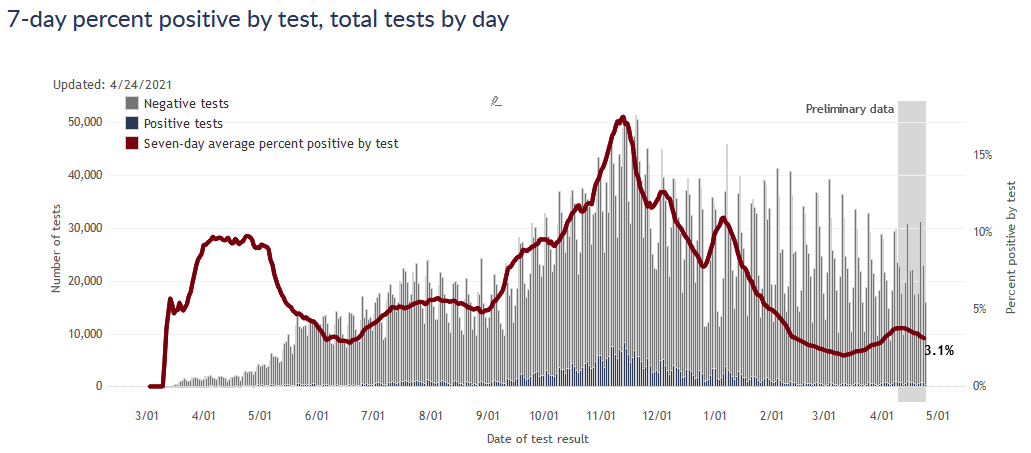
The first mixed signal comes in cases and infections. Reported cases ticked back up a bit, but positivity rate was flat and cases by date of diagnosis seem to still be decreasing slightly. Overall my guess is that infections are still decreasing slightly.
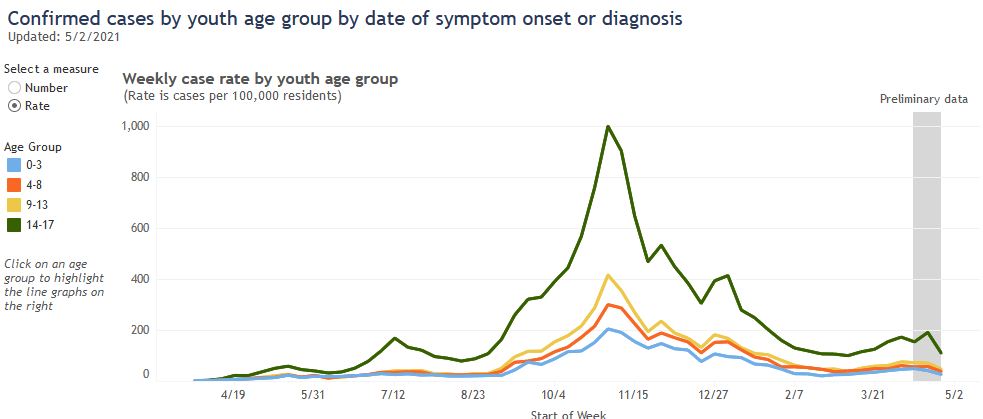
Looking at cases by age group, there’s a hint that cases in the 14-17 group might be increasing. (Ignore the latest week in the plot below, data is incomplete for this most recent week.) This could make sense - they would socialize more than younger kids, but vaccinations are only cleared for 16 and older. This could also easily be a statistical blip, though. I’ll be watching it in the coming weeks.
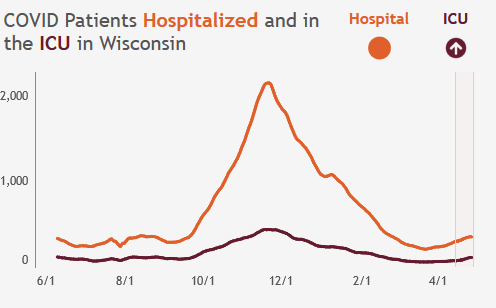
The number of current people hospitalized is still elevated, but that’s to be expected since this metric lags cases. (Because it takes some time to get out of the hospital after you go in and get diagnosed.)
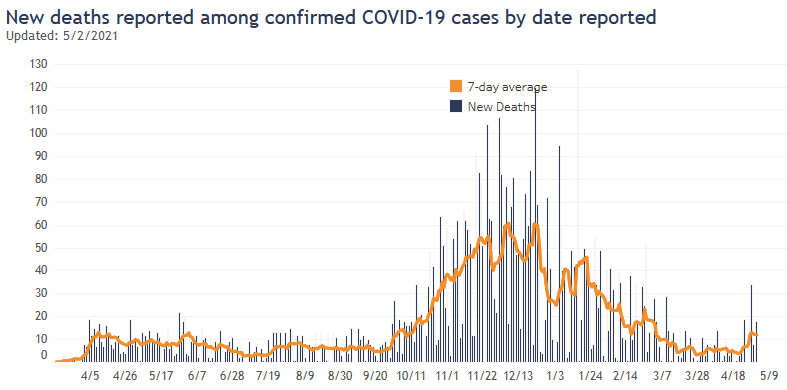
And finally, there was a larger than usual number of deaths reported this week, but that was at least mostly because of catch-up reporting. Deaths by day of death looks flat.
Overall it’s been a wait-and-see week.
25 Apr 2021
The spring wave has crested for Wisconsin as whole, though not yet in Milwaukee. Vaccination progress has reached 50% of adults but has slowed down.
Wisconsin spring
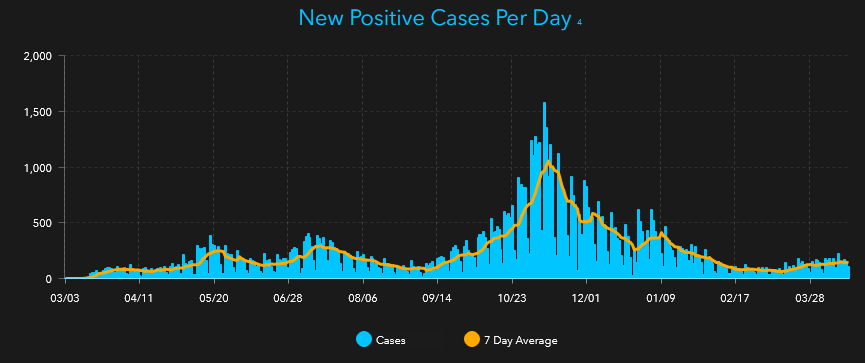
The spring wave has clearly peaked, thankfully long before it got bad at all. Both reported cases and test positivity rate are now declining.
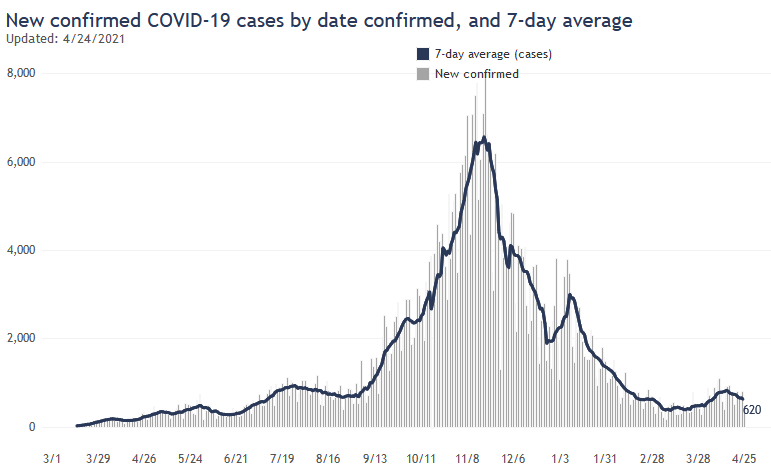
In terms of cases, this spring wave (in Wisconsin) turned out even smaller than the late summer wave from last year. It also hardly touched the largely vaccinated over-65 age group, so I would expect a relatively small number of deaths as a result - possibly not even detectable as a wave in the death data.
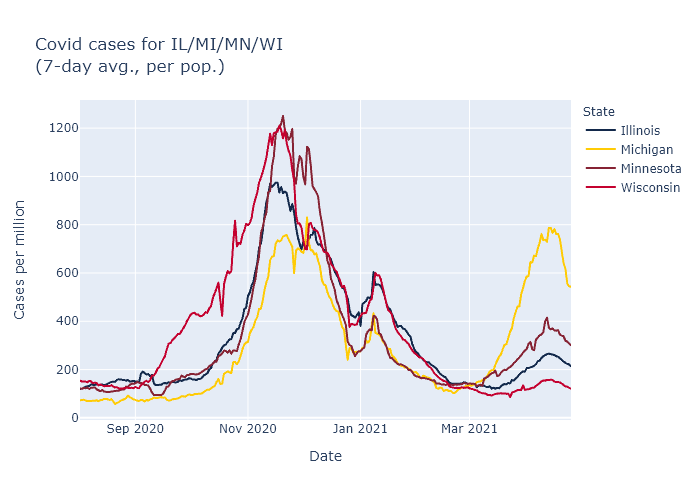
Interestingly, all four midwestern states with spring waves peaked this same week, even though the severity was much different in each state. My guess is that the common factors here are vaccinations and seasonality, since both vaccination pace and climate are quite similar among these states.
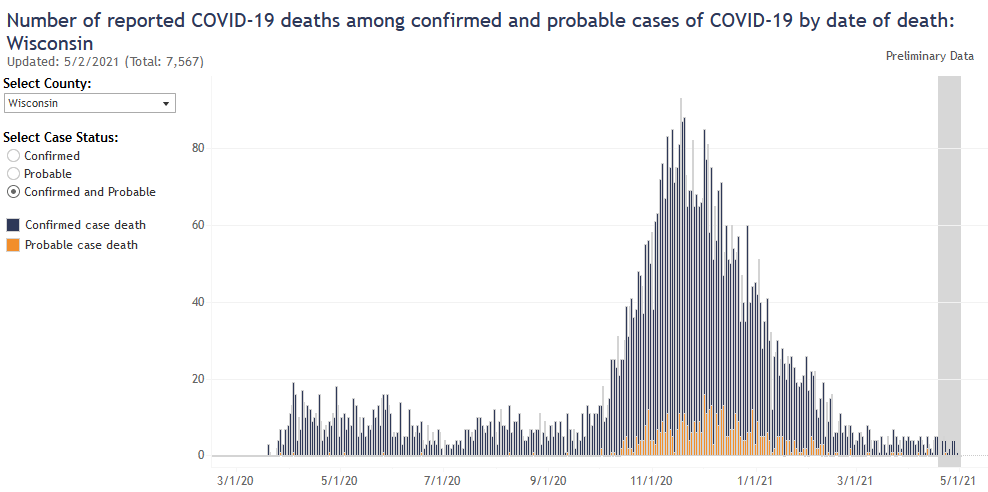
Note: a previous version of this plot had an incorrect y-axis scale. Data includes probable as well as confirmed cases.
Milwaukee
Unfortunately, Milwaukee appears to be an unfortunate exception here. While cases in Wisconsin as a whole have tipped downwards, in Milwaukee they are steady or even slowly rising.
A big part of the reason, I think, is the failure to get more vaccines to the central city. Below are two maps, the first showing percentage of people vaccinated, and the right showing new Covid cases in the last 30 days. The north side, not coincidentally, has both the lowest vaccination rates and the highest recent Covid rates.
Vaccination pace
Wisconsin has now vaccinated more than 50% of adults and more than 40% of the entire population. The number of doses being administered per week has started to decline, however. Vaccination rate peaked the week of April 4 - the week that eligibility opened to everybody - and has moderately declined since. Note that in the graphic below the vaccine bar for this week is not fully reported yet, so it will rise further.
The AP has a good story on the causes for the decline. In short, it’s a combination of the pause in administering the Johnson & Johnson vaccine (which has now been lifted), and slackening of demand now that everyone is eligible and the people most eager to get vaccinated have had their chance.
While I’m dismayed that the vaccine pace has slowed down, we are past the half-way mark for adults and it seems only natural that demand would decrease as fewer people remain to be vaccinated. I do encourage everyone to get vaccinated if you have not yet - and lower demand means it’s easier to do! Here are links for Milwaukee walk-in sites and Walgreens appointments.