30 Dec 2020
Cases continue declining in Wisconsin. Deaths numbers plateaued for a while and are a bit erratic, but I expect them to decline overall in the future. As happened with Thanksgiving, I predict a relatively small, temporary spurt of new cases from the Christmas and New Year’s holidays.
Cases and deaths
Several weeks ago I predicted that deaths had peaked. The intervening weeks have proven this wrong. Here is an update of the graph overlapping Wisconsin’s reported case and death curves, with about a two week delay.
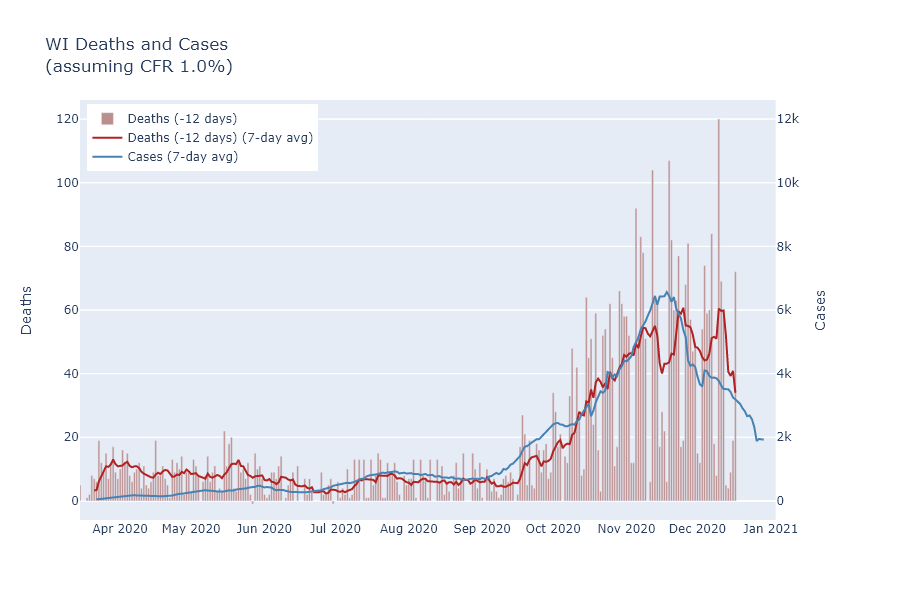
Clearly the death curve did not follow the case curve on its downswing, but instead stayed on an erratic plateau for a while. I think this is due not to anything strange with the virus, however, but to increased delays in recording deaths. The DHS website does provide data by date of death, in addition to the date of reporting. If I compare these curves, it is evident that the reporting delay increased during the fall surge. This is probably not surprising - health departments have had a lot more deaths to process.
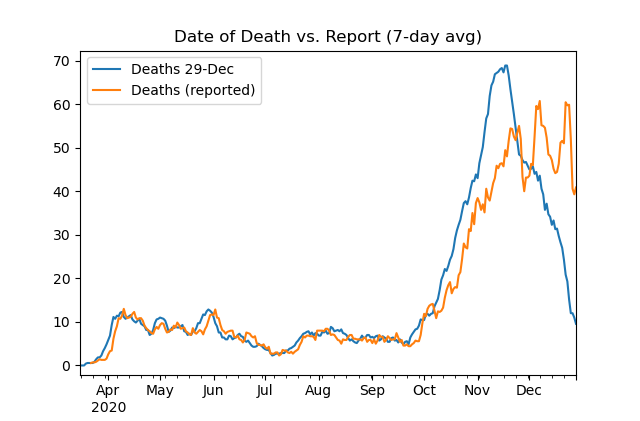
Be wary in interpreting this date-of-death curve, because dates from up to 8 weeks ago are not complete yet. Another way of looking at the reporting delay, actually, is to compare the date-of-death curve today with the curve from a week ago. The difference shows when the deaths reported in the last week actually occurred.
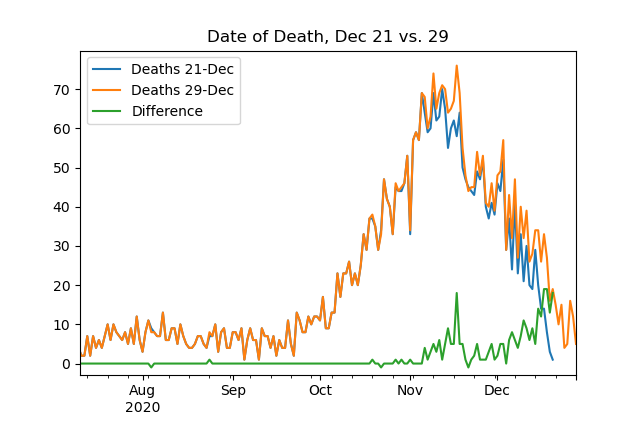
Note that for this plot I’ve switched from 7-day averages to daily numbers. It shows that many of the last week’s reported deaths are from recent days, but that a substantial number are still coming in from mid-November.
I still think reported deaths should start trending downward soon, but for now the timing is going to depend more on reporting than on the previous weeks’ cases.
The lump of covid in our stocking
I believe careful analysis shows that Thanksgiving did cause a small, temporary spurt of cases. I would expect the Christmas holidays to have a similar, somewhat larger effect.
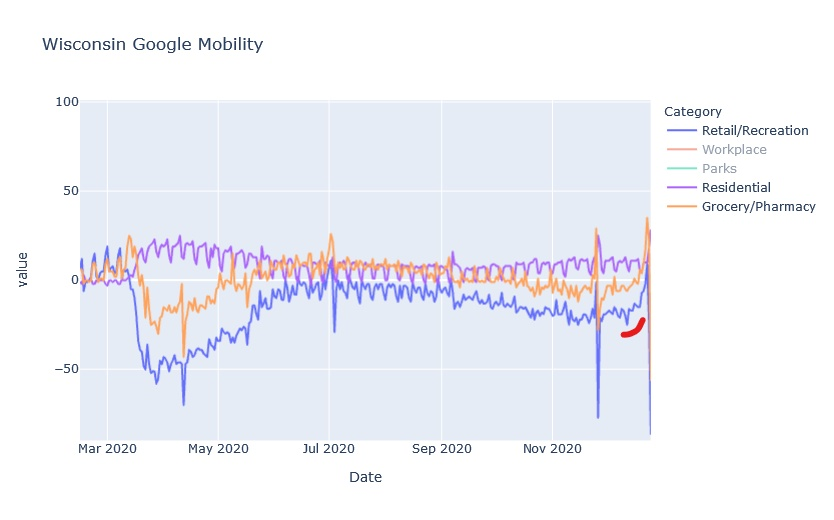
The reason I am more concerned now than at Thanksgiving is just that the Christmas season is a longer period of time, with New Year’s following closely. It is also preceded by more shopping and activity. Furthermore, since Thanksgiving did not create a large increase in virus, and we are further from Wisconsin’s peak, people may have decided to be less cautious for Christmas. The Google mobility data, indeed, show a much larger increase in visits to retail and recreation locations prior to Christmas than they did prior to Thanksgiving.
On the other hand, I would not expect people’s level of caution to change drastically, and it is true that we are at a lower level of virus activity right now. So my prediction would be that Christmas will cause a larger percentage increase of cases than Thanksgiving, but that the absolute case rate will not exceed the post-Thanksgiving mini-peak and the effect will still be temporary.
Here’s wishing for a happier 2021.
21 Dec 2020
Thanksgiving celebrations did not reverse the virus’s downward trend in Wisconsin, but I think the data shows it did lead to a small increase in infections.
Thanksgiving surge…
I have been somewhat skeptical of the idea of a Thanksgiving surge, and a first assessment of the data seems to confirm that intuition. Wisconsin’s case numbers have continued on their decreasing trend, which at least shows that celebrations did not reverse the virus’s trajectory.
And while the days after Thanksgiving did see a dip and spike in the case curve and positivity rate, I think those were primarily due to changes in reporting and testing over the holiday weekend, rather than spread of the virus.
Thanksgiving spurt
However, while these observations argue against the existence of a large surge, they do not rule out Thanksgiving spread altogether. And as time passes, the data available becomes more complete and we can get around some of these reporting effects. In particular, we can look at complete data by the date of testing, instead of the date of reporting.
First, here is the case data from Wisconsin, plotted by the date of diagnosis or of symptom onset. The lines separate weeks, grouped Monday through Sunday, and Thanksgiving Day is labeled.
If someone caught the coronavirus on Thanksgiving, it would take a few days for symptoms to develop and perhaps another day to seek testing. So I would expect any increase in cases from Thanksgiving to start appearing on Monday the following week.
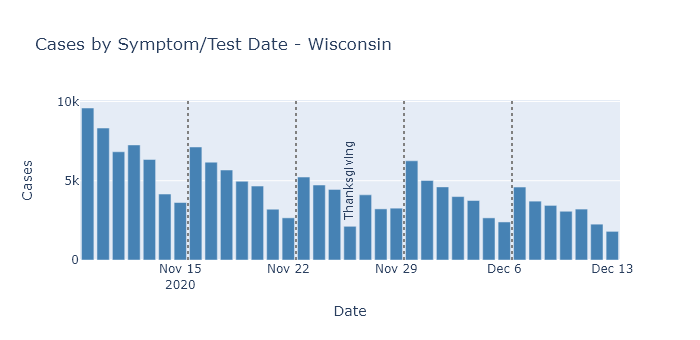
Sure enough, the Monday/Tuesday/Wednesday following Thanksgiving do have slightly higher case numbers than the same days prior to Thanksgiving. And this increase happens in spite of a longer-term downward trend.
We do not know from this data, however, how the level of testing has varied over this time. It could be that the number of tests were lower during Thanksgiving week, which would in turn lower the number of detected cases. An artificially low number of cases during Thanksgiving week could then make the week after Thanksgiving look like it was increasing, when perhaps true prevalence was not.
Unfortunately, DHS only publishes test numbers by result date, not test date, so I cannot test this question for the state. (Come on DHS, read my mind.) Milwaukee County’s dashboard, on the other hand, shows both cases and tests by test date. So let’s compare those for Milwaukee County.
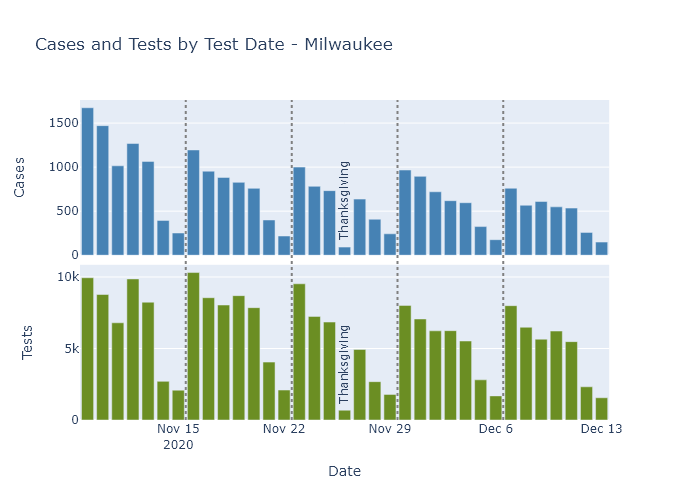
In this data, we see that testing numbers were much lower than usual for Thanksgiving day itself, and to a lesser extent the Friday after. For Monday/Tuesday/Wednesday, though, testing numbers are pretty consistent, with a gentle downward trend starting the week before Thanksgiving through two weeks after.
Since testing on these days of the week does not seem greatly affected by the holiday, for each week I summed only those three days of the week and computed the number of cases and the test positivity rate (cases divided by number of tests).
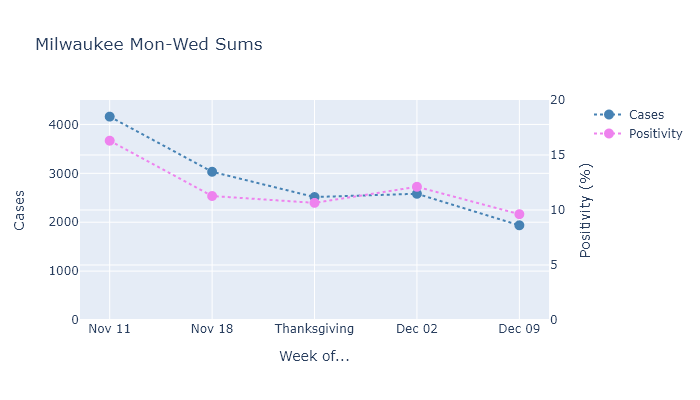
This analysis shows that the number of cases diagnosed after Thanksgiving went up very slightly (2515 to 2582, not really noticeable on the plot), and that the positivity rate went up as well. When both of these measures increase, I think it is a reliable indicator that true prevalence is also increasing.
Furthermore, this slight increase occurred in the middle of a longer-term decrease, so I think it is even clearer that it represents some amount of “excess” spread. If the holiday had not occurred, I would have expected that week to have fewer cases and lower positivity than the week before it; instead both metrics were higher.
Thanksgiving speedbump
We can be grateful that the excess Thanksgiving spread was only a speedbump on Wisconsin’s downslope, rather than the foothills of a new peak. In retrospect, I think this outcome make a lot of sense. People took a little more risk over the Thanksgiving holiday, and we got a little more virus. But because the increase in activity was only temporary, it did not change the overall trend.
In my opinion, Thanksgiving now holds a lesson for Christmas. Taking on a little more risk for the sake of the holiday did increase the spread, but it did not cause a disaster or reverse the state’s progress. This shows the continuing need for caution, but also that whatever precautions we have taken, they pretty much worked. Let’s keep them up and make sure the next speedbump is also a little one.
13 Dec 2020
Covid outcomes are very strongly affected by age. What does that age dependence look like in Wisconsin, and how does our mortality rate compare to scientific estimates?
That is no virus for old men*
The bar graphs below show the age distribution of Wisconsin’s population, Covid cases, Covid hospitalizations, and Covid deaths. The data are cumulative up until the present. These graphs are similar to ones on the DHS’s site, except that here I collect them together and compare them with population.
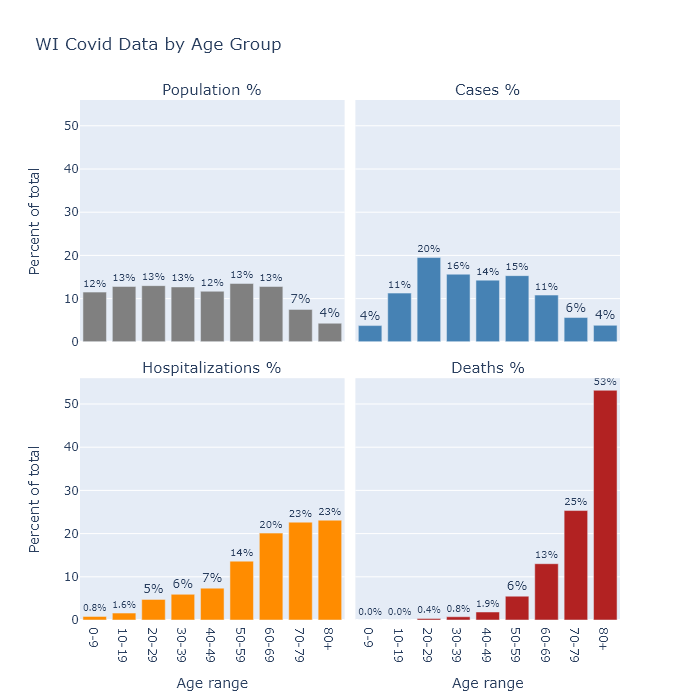
The distribution of population is quite flat, other than starting to taper off at age 70 as people pass away. Relative to shares of the population, Covid cases are a little higher in the middle aged, substantially higher for people in their 20s, and much lower for children under 10. This lower incidence among children could indicate that they are less susceptible to the virus, or it may only reflect the lower likelihood of diagnosing an infection as Covid in that age group.
Hospitalizations show a pronounced swing of the distribution toward the elderly - though still with plenty of middle-aged patients - and deaths shift that way even further. In other words, the older a person is, the more likely their case will require hospitalization, and the more likely their hospitalization will end in death.
To estimate the chance that a Covid case results in death, we can calculate Wisconsin’s case fatality rate (CFR) by dividing the number of deaths in each age category by the number of cases as of two weeks ago (since that’s about the delay Wisconsin seems to have between its reported case and death curves). This is distinct from the infection fatality rate (IFR), which is deaths divided by infections. Not all infections, perhaps not even most infections, are detected and recorded as cases. Therefore the IFR should be lower than the CFR.
In the table below, I compare Wisconsin’s CFR it with an estimate of the IFR from a recent paper. As I would expect from the bar graphs above, the fatality rate increases with age. In fact it increases exponentially (and I mean exponential literally, not figuratively): with each 10 years of age, the fatality rate goes up by about a factor of 3.
| Age group |
Wisconsin CFR |
Expected IFR |
| 0-9 |
0% |
0.001% |
| 10-19 |
0% |
0.003% |
| 20-29 |
0.02% |
0.01% |
| 30-39 |
0.05% |
0.03% |
| 40-49 |
0.14% |
0.12% |
| 50-59 |
0.38% |
0.39% |
| 60-69 |
1.3% |
1.3% |
| 70-79 |
4.8% |
4.3% |
| 80+ |
15% |
14% |
| Overall |
1.1% |
1.0% |
Wisconsin’s CFR matches the IFR estimate remarkably well. In fact it is too good a match, because if the observed CFR is this close to the expected IFR, that would imply that Wisconsin is actually detecting all of its Covid infections. If we are actually only recording, say, one-half or one-third of the true infections, then Wisconsin’s total IFR would be only one-half to one-third of its CFR (i.e. 0.55% or 0.37%).
I am not sure how to reconcile this comparison. The paper analyzed multiple data sets, some of which did have lower IFRs, so Wisconsin’s true IFR probably does fall in its range of uncertainty. Wisconsin’s relatively low CFR may also be evidence that we are in fact diagnosing a higher proportion of cases than most models allow. Youyang Gu’s Covid model, for example, estimates that Wisconsin detects less than 1 in 3; I suspect we’re detecting a higher proportion.
It’s also possible that the IFR has changed over time, since most of this paper’s data came from earlier stages of the pandemic. Perhaps now treatment has improved; or, more speculatively, tactics for reducing spread have also lowered the average viral dose and decreased the likelihood of death. Or maybe somehow Wisconsin has more favorable demographics for the disease (other than age, which is accounted for), though I have no good guess for which demographic variable that may be.
The young in one another’s arms
In any case, though the overall IFR is uncertain, the strong dependence on age is well established. Given the low mortality risk to younger age groups, is it ridiculous for them to take measures to prevent catching the disease?
I do not think so, because while the risk associated with having the disease may be quite low for younger people, the risk associated with spreading it is another matter. I take preventive measures not because I’m afraid of the virus (0.05% CFR for me), but because I don’t want to spread it to my parents (1.3%) or my grandparents (15%).
DHS publishes a chart showing the rate of cases in different age groups over time. With one exception, the dynamics are very similar for all age groups. People over 65 have a little lower prevalence than other groups, but it rises and falls with everyone else.
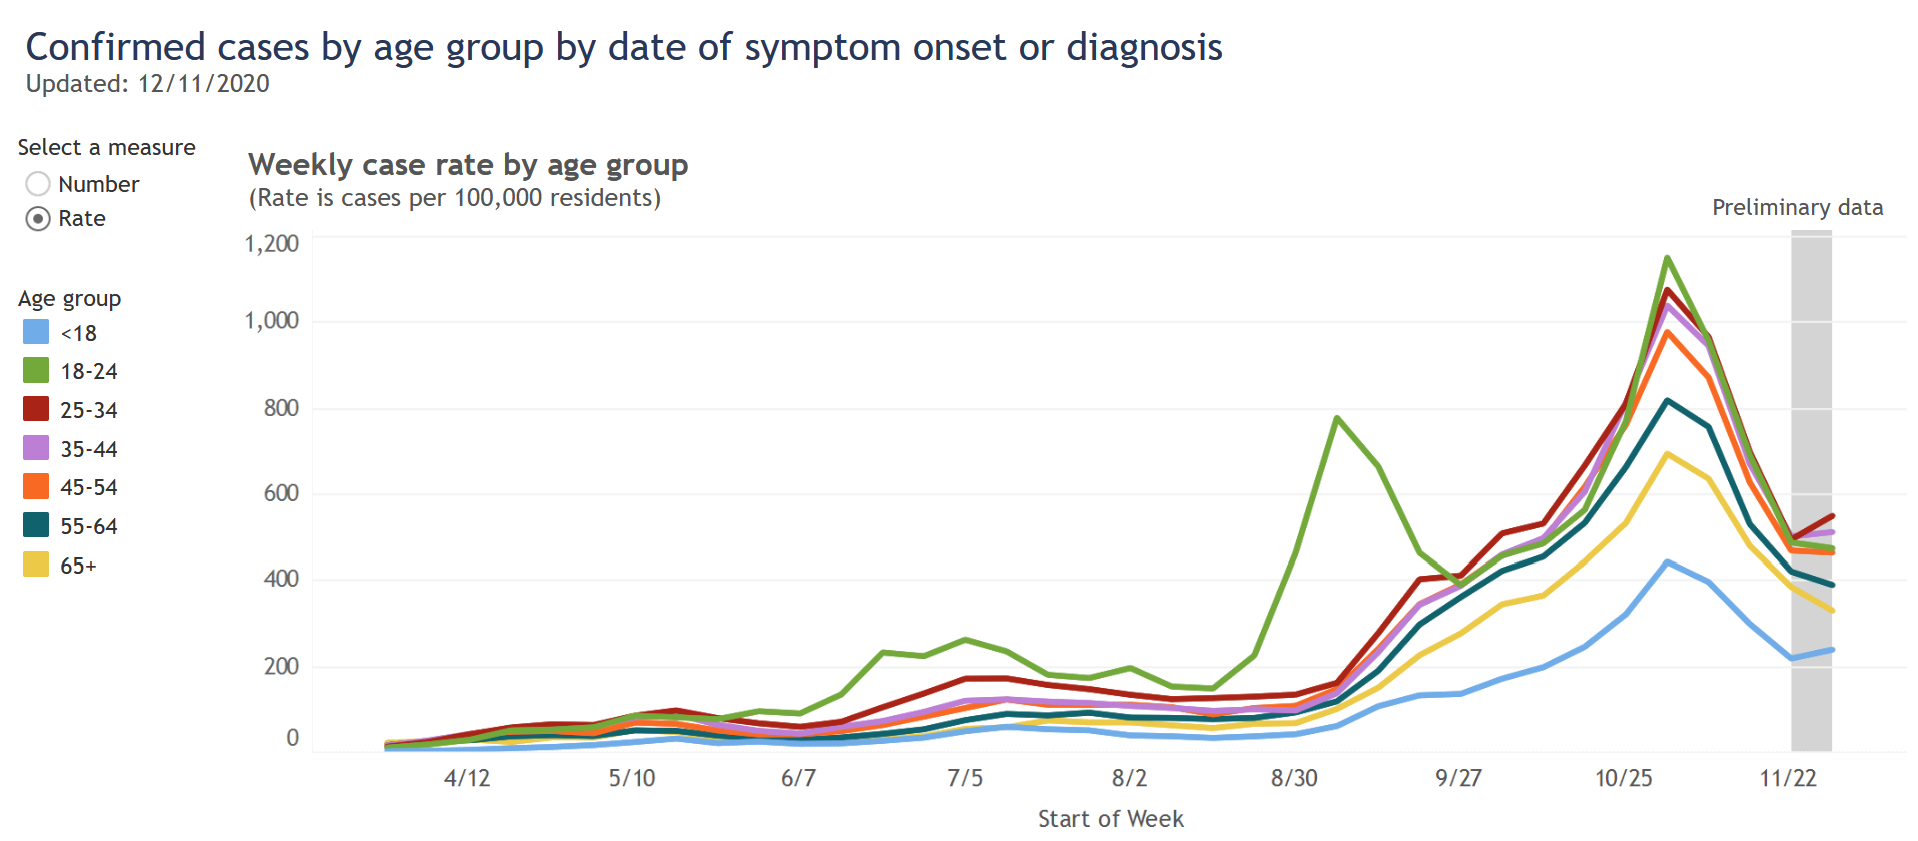
The 18-24 category is the one exception, but I believe it proves the rule. Their surge at the end of August was a result of returning to college, but this surge came under control and the cases in this age group then fell in line with other ages.
These events might show that it is possible to successfully segregate younger people from older ones. But it happened in this very specific college sub-group, already age-segregated, under the control of administrators who took pretty intrusive containment measures. I doubt that situation could be replicated more broadly.
So while age is clearly a very strong risk factor for dying from Covid, the strongest risk factor for catching Covid is just…how much Covid everyone else has. This risk factor is not strongly segregated by age, so we can all have an impact on it.
07 Dec 2020
Wisconsin’s case load is now declining, and I think deaths have also now peaked. The Thanksgiving weekend is making the data difficult to interpret, but I do not think there is any sign yet of a Thanksgiving surge.
Past the peak
Two weeks ago I wrote that Wisconsin’s cases had peaked, and thankfully that has been confirmed by about a 1/3 decline in daily new cases since then. New hospitalizations have also declined. The trend is roughly similar in all regions of the state, although Milwaukee’s decline is slower than the rest.
As for reported deaths, I believe they may be at their peak right now. Since it takes a few weeks for a new case to progress to death, we expect the death curve to have a similar shape to the case curve, just delayed. I estimated a delay and a ratio of deaths to cases (the case fatality rate or CFR) to get the best fit between the two curves, and it indicates that deaths should be peaking right now.
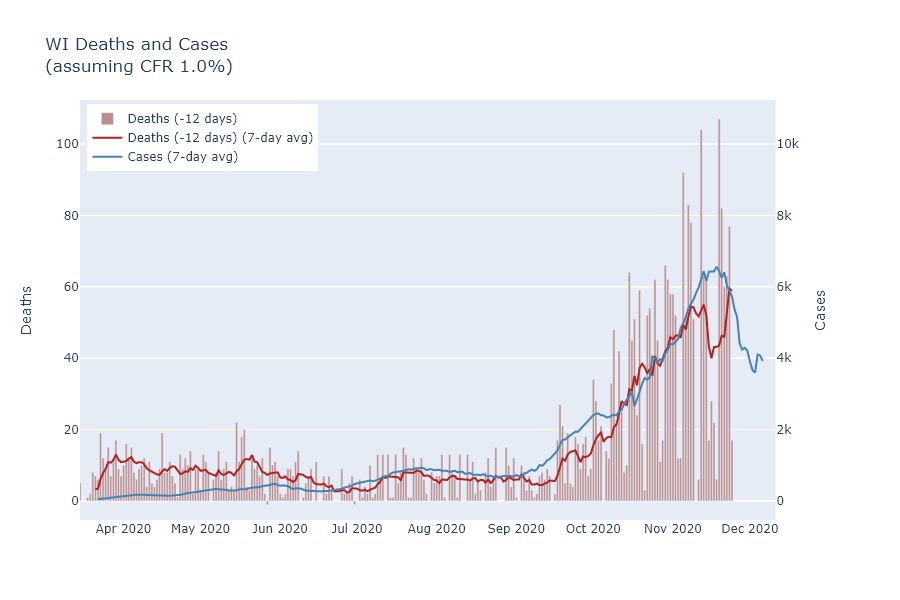
I’m taking the idea for this comparison from scientist Trevor Bedford, who uses a CFR of 1.8% and delay of 22 days to model the United States as a whole. For Wisconsin, I found that a CFR of 1.0% and delay of 12 days seems to match the data better. This would imply that Wisconsin may be detecting a higher proportion of cases than the country as a whole, and that it has a shorter time period between reporting a case and reporting a death.
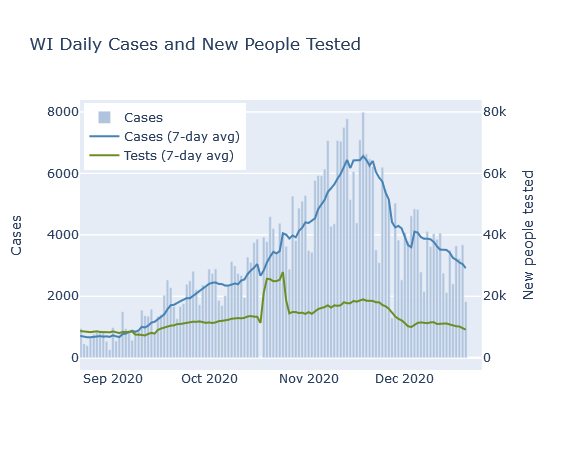
Thanksgiving data
You may object, however, that the previous plot showed a huge dip in the deaths average right where I claim that it should be peaking. I think this dip is purely a result of delayed data reporting over Thanksgiving weekend. If not for the holiday, the 7-day average of deaths would have peaked this past week; instead, it will peak this coming week as the low-reporting days drop out of the average, after which it will start to decline.
This holiday delay is a problem that appears in all the tracking data right now. As another example, consider the positivity rate for cases vs. new people tested, shown on the DHS website, which shows a particularly strong discontinuity. The four days following Thanksgiving all have much lower numbers of test results, and much higher positivity, so that the 7-day average takes a strong turn upward starting at Thanksgiving. But on December 3, exactly 7 days after Thanksgiving, the 7-day average turns right back around and starts going down again.
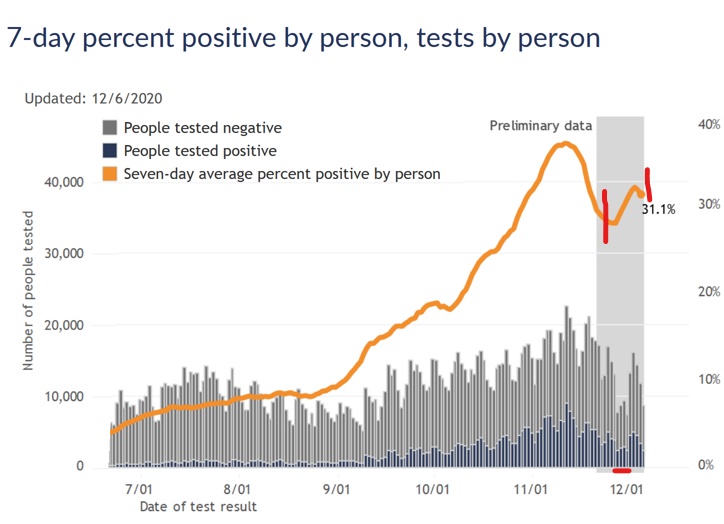
I think this is all an artifact of lower testing availability, and possibly also delayed reporting, on the four days of Thanksgiving weekend. Since many testing locations were closed over the weekend, it’s likely that the tests that did occur were more urgent and more likely positive than usual. Once testing returned to its normal availability, the positivity rate begins to return to its previous trend.
An analogous artifact appears in the 7-day average case plots. When a single day is an outlier, with unusually low case numbers, the 7-day average unsurprisingly dives downward on that day. It’s easy to forget, however, that the 7-day average will then also shoot upward on the day that outlier is removed from the average, 7 days later.
To illustrate, I marked two of these instances in the case plot below. The pair on the right is the result of Thanksgiving - the Friday after had very low cases, decreasing the average and creating a mirror-image spike on December 4. That spike was not a sign of a Thanksgiving surge, only a quirk of the averaging method. The very same thing happened in October, when no cases were reported on October 17 due to DHS system maintenance, and the average spiked 7 days later on October 24.
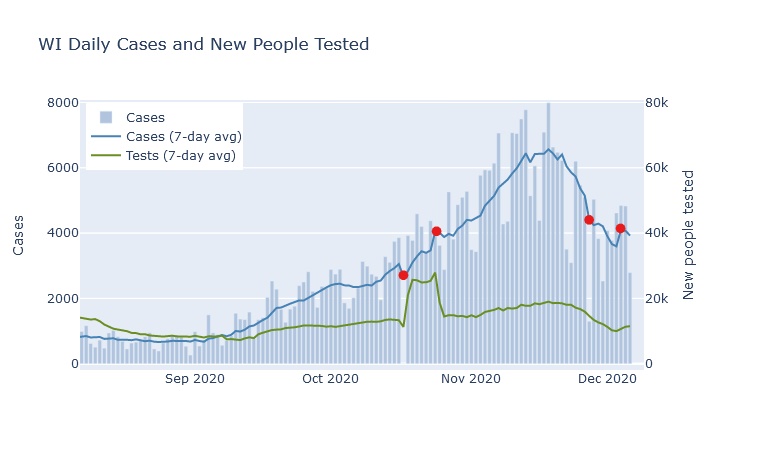
All these irregularities make it very difficult to tell if Thanksgiving itself has caused any kind of surge in the virus. Now that all the Thanksgiving weekend days have passed out of the averages, though, next week’s trend should be more reliable.
My intuition is actually that Thanksgiving will not have a large effect on the numbers. I would guess that most families took a level of precaution about Thanksgiving that was similar to what they were taking in the rest of their lives. And can one day, even a celebratory get-together, really count for so much compared to all the work, school, and social contact that happens over weeks of regular life? But that is just a guess; to find out I’ll watch the numbers next week.
29 Nov 2020
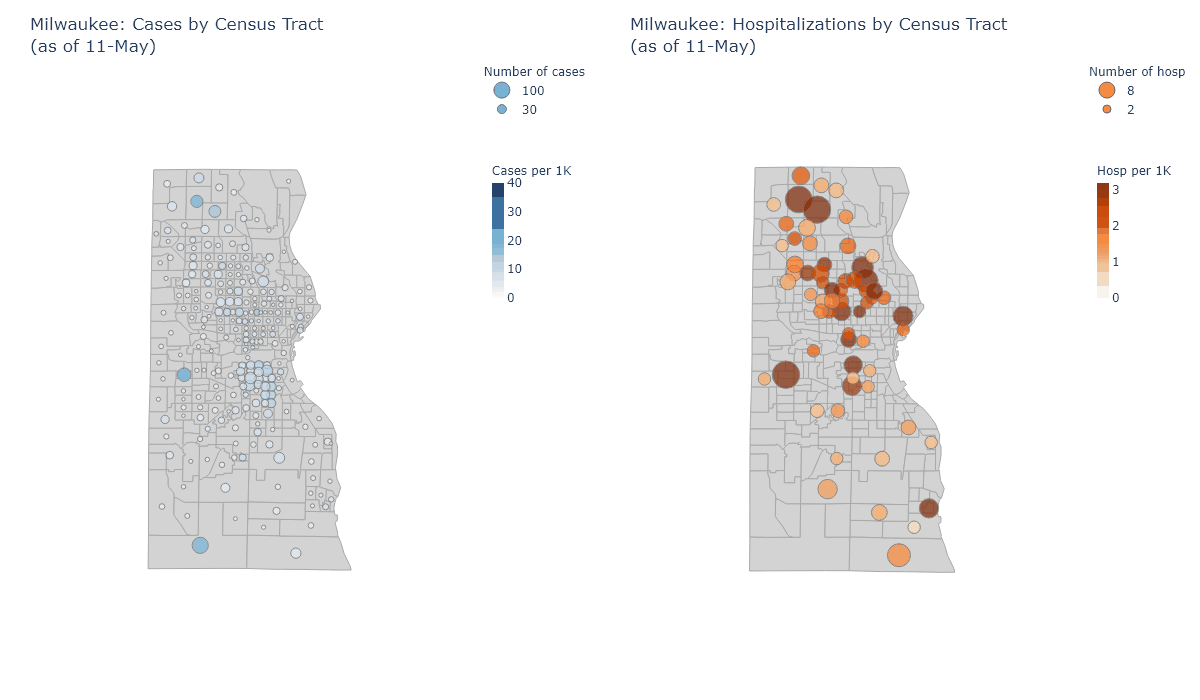
Milwaukee County contains one million people, one-sixth of Wisconsin’s total. Within this one county, there are enough people and enough diversity to give Milwaukee’s corner of the pandemic its own geography and its own narrative.
Pan-geography
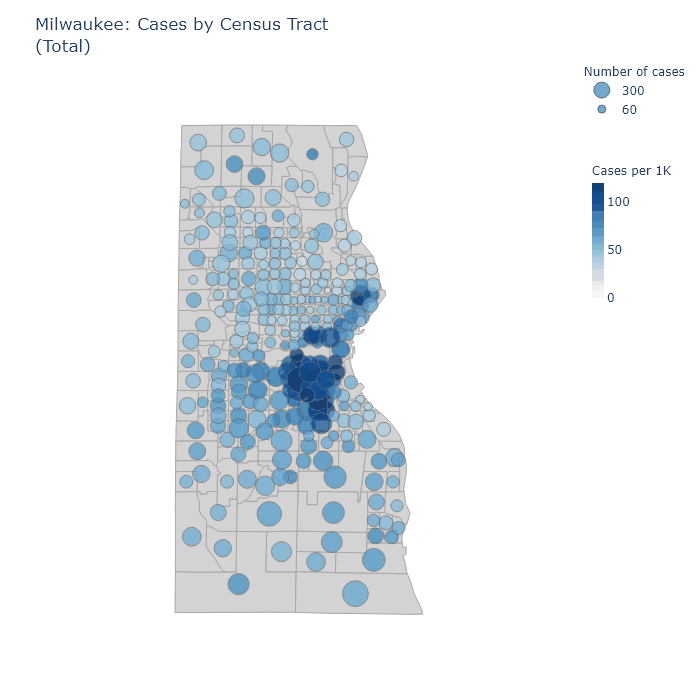
The animation below maps out total cases, hospitalizations, and tests for each census tract in Milwaukee County. It has the same format as my statewide maps - the size of the bubble corresponds to the absolute number inside a tract; while the color of the bubble corresponds to the value per thousand residents. For example, a larger bubble indicates a greater number of cases, while a darker bubble indicates that a larger percentage of the population has had a case.
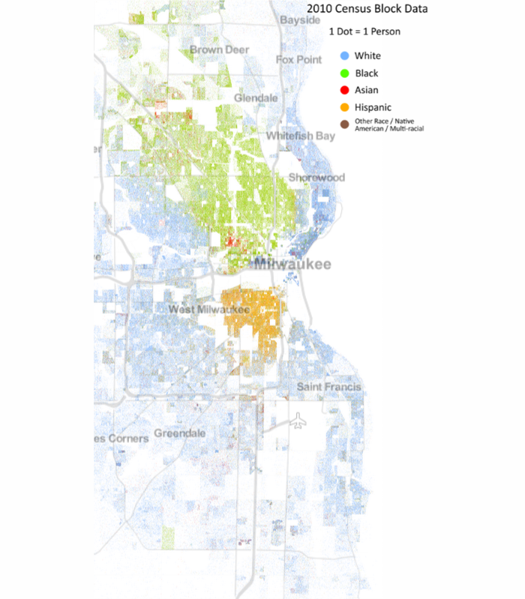
The patterns in these maps strongly echo the demographic boundary lines of the city. To show this, here is another map: this one plots a dot for each resident, randomly distributed within census tracts, and colored according to race. It comes from a project at the University of Virginia. The exactness with which the Covid maps follow the boundaries of the racial map is striking.
Returning to the Covid maps, we can see that the highest concentrations of cases have occurred in the predominantly Hispanic near south side, and in an arc from Marquette University through downtown up the East Side to the University of Wisconsin-Milwaukee.
Hospitalizations are also high in the Hispanic south side but relatively low in the downtown-East Side arc, I assume because of younger demographics in that area. In addition, however, hospitalizations are high throughout the majority-Black areas of the city, from the near north side to the far northwest. They are also relatively high in much of the majority-white parts of the south side.
Some of the tracts with the highest hospitalization numbers, when examined more closely, turn out to be the sites of long-term care facilities. The tract in the southeast bordering the lake, third from the bottom, appears to have several, two of which I can find on the DHS’s list of facilities with Covid cases.
More affluent predominantly-white areas such as Wauwatosa and the North Shore suburbs, in contrast, are relatively spared from cases and hospitalizations. I would guess this is primarily because white-collar jobs and sufficient money naturally increase a family’s ability to work from home, isolate when necessary, and seek out testing. In fact, the rate of testing is highest in these same areas, along with the Marquette-to-UWM arc.
Pan-narrative
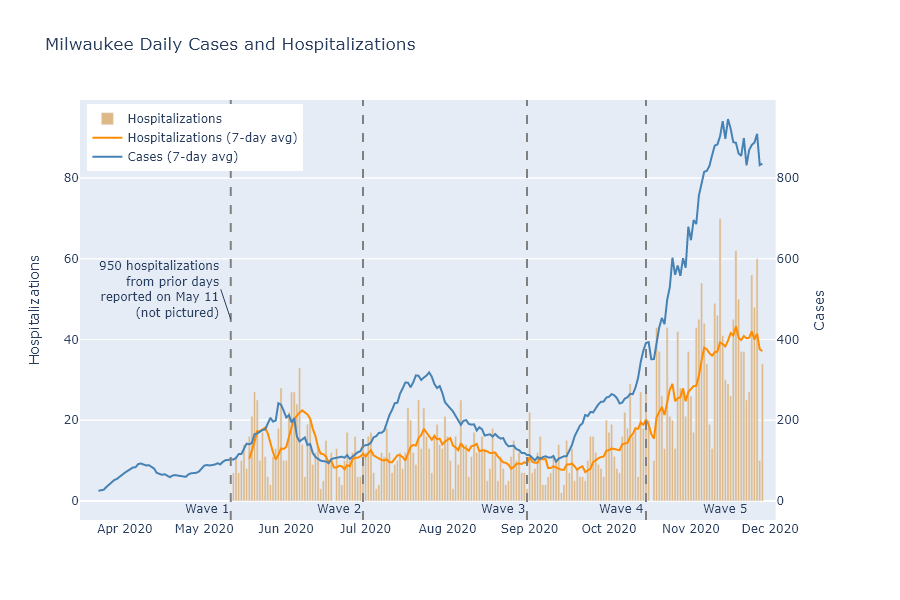
By looking at these same maps over time, I think I can identify 5 demographically distinct waves in the pandemic’s run through Milwaukee.
-
Black Milwaukee was struck first and hardest in the spring. Recorded cases are low in this stage because of the lack of testing, but hospitalizations and deaths are high in the Black north side.
-
Hispanic Milwaukee is hit next. Cases are very concentrated in the Hispanic near south side, although hospitalizations and deaths are more moderate.
-
Students and younger people in the downtown-East Side arc contribute to a wave of cases in the late summer, but are not accompanied by many hospitalizations. Cases rise moderately in the rest of the city, along with hospitalizations.
-
Early fall continues the pattern of the late summer, but with even more cases at Marquette and UWM campuses.
-
Late fall brings a surge across the whole city, with only the North Shore suburbs and Wauwatosa relatively spared.
Below, a plot shows the time spans of these waves overlaid on daily cases and hospitalizations, and a map animation illustrates their geography for each of these stages. Each frame shows the sum of cases and hospitalizations reported in each wave’s time period.
One practical lesson from this analysis, I think, is that the majority-Black north side needs better access to testing. Even now, with testing more plentiful, this region has high hospitalizations but relatively low rates of tests and detected cases.
More broadly, it shows how the virus spread along social networks. Milwaukee is lamentably segregated by race, and the virus often followed the contours of that segregation. I am a white professional, and I personally know relatively few people who have had Covid; but a friend with Hispanic family on the south side saw many of them get the virus over the summer. It has also followed contours of age and occupation, having very different effects on downtown bar-hoppers and nursing home residents, office workers and meat packers.
For all of us, our experience of the pandemic has probably depended very much on our demographic and social group - even on our street address.